Free Excel download for coworking operators in India
A coworking financial model in rupees
Plan a new centre month by month for three years: the cash you need, the occupancy you need to break even, when it pays back and the margin once it is full. Every number is a live formula you can change.
Excel file, about 90 KB. No sign-up.
What's inside
Four parts, all in one workbook. Inputs are the only cells you type in; everything else calculates.
Inputs
Area, seats, rent, CAM, rent-free months, escalation, security deposit, fit-out, furniture and IT, pre-opening costs, price by product, member deposits, collection days, the occupancy ramp and eight running cost lines.
Monthly
36 months from opening: occupancy, seats sold, revenue, every cost line, EBITDA, cash collected, deposits in and out, and cumulative cash.
Summary
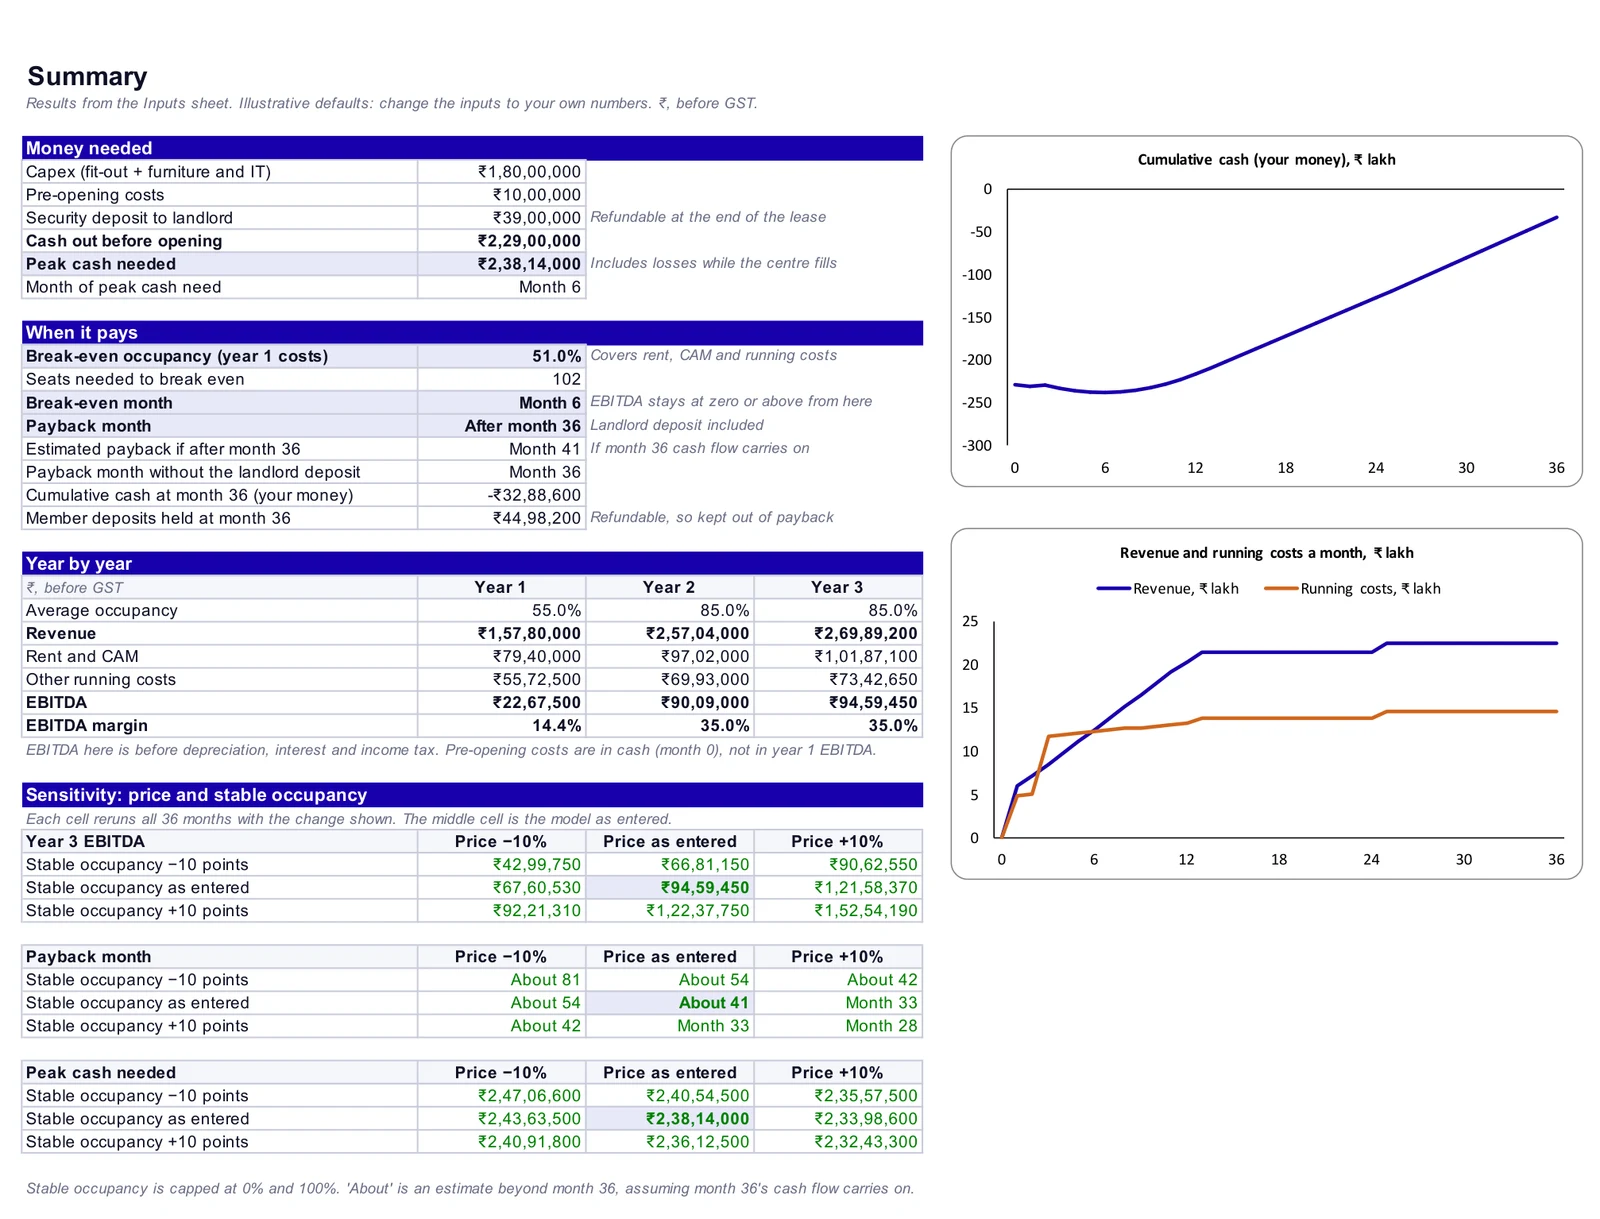
Capex, peak cash needed, break-even occupancy, break-even month, payback month, revenue and EBITDA for years 1 to 3, the EBITDA margin and two charts.
Sensitivity
What happens to year 3 EBITDA, payback and peak cash if your price is 10% higher or lower, or stable occupancy is 10 points higher or lower.
How to use it in 5 steps
- 1
Download and open it
Made for Microsoft Excel; it also opens in Google Sheets. Start on the Read me sheet.
- 2
Enter the space and the lease
Area, sellable seats, rent and CAM per sq ft, rent-free months, escalation and the deposit the landlord wants.
- 3
Enter your upfront quotes
Fit-out per sq ft, furniture and IT per seat, and pre-opening costs such as broker fee, legal and launch marketing.
- 4
Enter prices, fill-up and running costs
The share of seats and the realised price for each product, how fast you expect to fill up, and your monthly costs.
- 5
Read the Summary
Check peak cash, break-even and payback, then look at the sensitivity tables to see how much room you have if things go slower.
The key formulas
All amounts before GST. Month 1 is the first month the centre is open; month 0 is the cash spent before opening.
- 1
Seats sold
Sellable seats × occupancy that month, rounded down
Occupancy rises in a straight line from month 1 to the stable level, then holds.
- 2
Revenue
Seats sold × average realised price per seat
The average is weighted by your product mix. Prices rise once a year by the increase you enter.
- 3
EBITDA
Revenue − rent − CAM − running costs − variable costs
Rent is zero in the rent-free months. Rent and costs rise every 12 months by the rates you enter.
- 4
Break-even occupancy
(Rent + CAM + running costs) ÷ (price − variable cost per seat), rounded up, ÷ seats
The share of seats that must pay to cover the monthly costs in year 1.
- 5
Cumulative cash
− Cash out before opening + cash collected − costs paid, month by month
Cash collected follows your collection days. Deposits from members are kept out because you must return them.
- 6
Peak cash and payback
Peak cash = the deepest point of cumulative cash. Payback = first month it is back to zero
Payback is shown with and without the landlord's deposit.
What the defaults give
The model opens with an illustrative 10,000 sq ft, 200-seat centre: the same numbers as the setup cost calculator, plus 2 rent-free months, 5% yearly rent, price and cost increases, ₹10 lakh of pre-opening costs, 2 months’ member deposits and 15 days to collect. Change them to your own numbers. For a quick check of break-even occupancy before you open the workbook, try the coworking break-even calculator.
- Capex (fit-out + furniture and IT)
- ₹1,80,00,000
- Cash out before opening (with ₹10 lakh pre-opening and ₹39 lakh deposit)
- ₹2,29,00,000
- Peak cash needed
- ₹2,38,14,000, in month 6
- Break-even occupancy
- 51% (102 of 200 seats)
- Break-even month
- Month 6
- Payback month
- After month 36: about month 41 if month 36’s cash flow carries on. Month 36 without the landlord deposit
- Year 1 revenue and EBITDA
- ₹1,57,80,000 and ₹22,67,500 (14.4%)
- Year 3 revenue and EBITDA
- ₹2,69,89,200 and ₹94,59,450 (35.0%)
Questions about the financial model
What does a coworking financial model show?
What is a good profit margin for a coworking space?
Can I use this as a coworking business plan in Excel?
Are the default numbers a benchmark?
Why is the payback later than the break-even month?
Should the numbers include GST and TDS?
Why are member deposits kept out of payback?
Is this financial or tax advice?

Plan the centre in Excel. Run it in rivonOS.
One hour with the people who built it, using your own centres. If rivonOS isn't the right fit, we'll tell you.